Abstract
On this article, I'll try CAM(Grad-CAM) to high resolution images. Cam has the potential for object-detection. So, I will make CNN model and by CAM, check if it really works.About CAM(Grad-CAM) itself, I'll recommend the theses below.
- Learning Deep Features for Discriminative Localization
- Grad-CAM: Why did you say that? Visual Explanations from Deep Networks via Gradient-based Localization
Data
This time, I need higher resolution images than cifar-10 color image datasets. So, I chose Oxford’s Pet dataset. You can download the data from the link below.import glob
import os
import matplotlib.pyplot as plt
DATA_DIR = '.../data/animal/images'
image_name_list = glob.glob(DATA_DIR + '/*.jpg')
images = []
labels = []
for image_name in image_name_list:
# to skip some gray scaled images
try:
image = plt.imread(image_name)[:,:,:3]
images.append(image)
image_label = '_'.join(image_name.split('/')[-1].split('_')[:-1])
labels.append(image_label)
except:
print(image_name)
On my environment, it is too hard to use all the images, even if I use fine-tune. So I'll limit the data classes to just two, Pug and Russian_Blue.
selected_ind = [ i for i,label in enumerate(labels) if label in ['pug', 'Russian_Blue']]

selected_resized_images = np.array([cv2.resize(image, (300, 300)) for image in np.array(images)[selected_ind]])/255.0
selected_label_hot_encoded = pd.get_dummies(np.array(labels)[selected_ind]) for i,img in enumerate(selected_resized_images):
plt.subplot(3,3,i+1)
plt.imshow(img)
if i == 8:
break
plt.show()
Code
Make CNN model
If I tried to make full-tune model for the color images with this size, it takes huge time to train on my environment. So, I'll adapt fine-tune model of VGG16.About fine-tune and VGG16, please check the following articles.
Anyway, for visualization with CAM(Grad-CAM), we need to make CNN model. Because this is just a small experiment, I just set ephoch = 5.
vgg_model = VGG16(weights='imagenet', include_top=False, input_shape=(300,300,3))

# get layers and add average pooling layer
vgg_model.layers.pop()
x = vgg_model.layers[-1].output
x = GlobalAveragePooling2D()(x)

# output layer
predictions = Dense(2, activation='softmax')(x)

model = Model(inputs=vgg_model.input, outputs=predictions)

# freeze pre-trained model area's layer
for layer in vgg_model.layers:
    layer.trainable = False

# update the weight that are added
model.compile(optimizer='rmsprop', loss='categorical_crossentropy')
model.fit(selected_resized_images, selected_label_hot_encoded)

# choose the layers which are updated by training
layer_num = len(model.layers)
for layer in model.layers[:15]:
    layer.trainable = False

for layer in model.layers[15:]:
    layer.trainable = True

# training
model.compile(optimizer=SGD(lr=0.001, momentum=0.9), loss='categorical_crossentropy', metrics=['accuracy'])
model.fit(selected_resized_images, selected_label_hot_encoded, batch_size=32, epochs=5, shuffle=True, validation_split=0.3)
Epoch 1/1
400/400 [==============================] - 535s 1s/step - loss: 0.6869
Train on 280 samples, validate on 120 samples
Epoch 1/5
280/280 [==============================] - 541s 2s/step - loss: 0.6535 - acc: 0.7179 - val_loss: 0.6489 - val_acc: 0.7583
Epoch 2/5
280/280 [==============================] - 540s 2s/step - loss: 0.6161 - acc: 0.8250 - val_loss: 0.5969 - val_acc: 0.8000
Epoch 3/5
280/280 [==============================] - 541s 2s/step - loss: 0.5457 - acc: 0.8393 - val_loss: 0.4931 - val_acc: 0.8750
Epoch 4/5
280/280 [==============================] - 539s 2s/step - loss: 0.4501 - acc: 0.9250 - val_loss: 0.3827 - val_acc: 0.9167
Epoch 5/5
280/280 [==============================] - 560s 2s/step - loss: 0.3419 - acc: 0.9321 - val_loss: 0.2863 - val_acc: 0.9083This model can classify Pug and Russian Blue with more or less 0.9 accuracy.
Visualize with CAM(Grad-CAM)
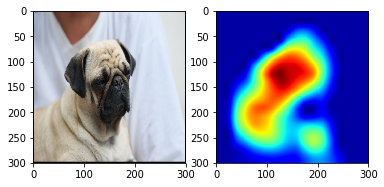
By visualize_cam() of keras-viz, we can get the heatmap through Grad-CAM. The following function is to visualize the original image and its heatmap by taking index as an argument. On this case, the targets are Pug and Russian Blue. So, if the image is Pug, the heatmap shows the relevant points to Pug.from vis.visualization import visualize_cam
def compare_original_heatmap(i):
if selected_label_hot_encoded.values[i][0] == 1:
heat_map = visualize_cam(model, 19, 0, selected_resized_images[i])
else:
heat_map = visualize_cam(model, 19, 1, selected_resized_images[i])
plt.subplot(1,2,1)
plt.imshow(selected_resized_images[i])
plt.subplot(1,2,2)
plt.imshow(heat_map)This is one of the examples. Pug’s points are shown as red.
compare_original_heatmap(3)
For the visual understanding, let’s visualize more.
compare_original_heatmap(19)
compare_original_heatmap(50)
compare_original_heatmap(100)
compare_original_heatmap(200)


