Abstract
On this article, I'll try image segmentation and compression by K-means.This is shown on the popular book, Pattern Recognition And Machine Learning, as an example of K-means. I've never used K-means with setting the segmentation and compression of images as a main purpose, because it is not practical way. But it looks fun on the book. So, I'll try.
Here, for experiment, the code is written in Julia.
K-means code
This time, I’ll use the K-means I made on the article below.
From my GitHub repository, you can clone the codes.
Detail
On image data, each pixel is composed of three factors, R, G and B. We can regard each pixel as a data point. So, for example, the color image with can be expressed as matrix(dataframe). We can adapt K-means to that. By this, each data point will belong to a cluster. By replacing the data point with the corresponding cluster’s centroid, we can do segmentation and compression of image.
Code
The image I’m using is the header image of this blog.

After the image is downloaded on the directory, we can load the image.
using Images

dog = load("dog.jpg")
display(dog)
At first, I'll convert the image data to the appropriate form for K-means. On the code below, the variables, r, g and b are responding to image’s R, G and B’s values.
r = convert(Array{Float64}, vec(red(dog)))
g = convert(Array{Float64}, vec(green(dog)))
b = convert(Array{Float64}, vec(blue(dog)))
Make DataFrame.
using DataFrames

dogImg = DataFrame(r=r, g=g, b=g)
After cloning Cluster repository, I'll include the source code for K-means.
include("./Clustering/src/kmeans.jl")As a first trial, by setting three as a cluster number, I'll execute K-means to the data.
srand(1234)
k3 = kMeans(dogImg, 3)
To replace the pixels with the cluster’s centroids and to convert the DataFrame to image form, I'll write the functions. There are three functions, splitImg(), dataFrame2Matrix() and updateImg(). By the function splitImg(), the pixels are replaced with corresponding cluster’s centroid. By the function dataFrame2Matrix(), the DataFrame is converted to Matrix. The function updateImg() execute those two functions and make the reshaped output image.
function splitImg(img, kMeansResult)
    k = kMeansResult.k

    splitedImg = deepcopy(img)
    for cluster in 1:k
        indices = find(cluster .== kMeansResult.estimatedClass)

        for index in indices

            splitedImg[index, :] = DataFrame(kMeansResult.centroids[end][cluster])
        end
    end
    return splitedImg
end

function dataFrame2Matrix(data::DataFrame)
  r,c = size(data)
  matrix = zeros(r, c)
  for i in 1:r
      matrix[i, :] = vec(Array(data[i, :]))
  end
  return matrix
end

function updateImg(imgData, kmeansResult, img)

    splitedImg = splitImg(imgData, kmeansResult)
    splitedImgMatrix = dataFrame2Matrix(splitedImg)

    r = reshape(splitedImgMatrix[:, 1], size(img))
    g = reshape(splitedImgMatrix[:, 2], size(img))
    b = reshape(splitedImgMatrix[:, 3], size(img))

    original = rand(RGB, size(img)[1], size(img)[2])

    for row in 1:size(img)[1]
        for col in 1:size(img)[2]
            original[row, col] = RGB(r[row, col], g[row, col], b[row, col])
        end
    end
    return original
end
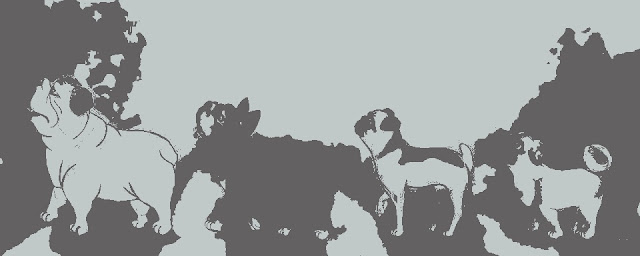
By executing the function, the output is as following. As you can see, the image is expressed by three colors.
updatedImg = updateImg(dogImg, k3, dog)
display(updatedImg)
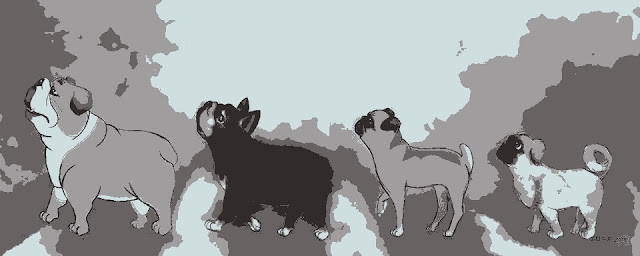
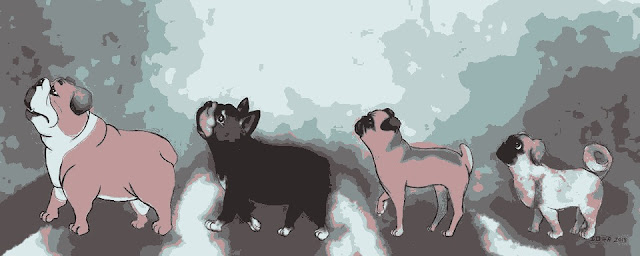
Let's check the outcomes of other cluster numbers.
imgs = []
srand(12345)
for k in 2:10
    result = kMeans(dogImg, k; initializer="kmeans++")
    updatedImg = updateImg(dogImg, result, dog)
    push!(imgs, updatedImg)
end

for img in imgs
    display(img)
end


It is fun.