Abstract
On this article, with Julia I'll roughly reproduce the simple analysis I did on Simple analysis workflow to data about default of credit card clients.After I wrote that article, I thought to write the following ones. But, I want to follow the same flow with Julia at first. So, I'll do.
Work Flow
The main purpose of this article is to follow the flow of the article below with Julia.About the detail, please check the article above. The steps are roughly as followings. On this article, some steps I'll skip.
- check data
- pre-processing
- make a model with one specific variable
- do simple univariate analysis
Code
At first, read the data and check it. With Julia, we can basically do those with same manner as Python.using DataFrames
using GLM
# load data
dataOrig = readtable("../data/UCI_Credit_Card.csv", header=true)
println("data size: "*string(nrow(dataOrig)))
println("default size: "*string(nrow(dataOrig[dataOrig[:default_payment_next_month].==1,:])))data size: 30000
default size: 6636About one-hot-encoding of categorical data and AUC score, I made the functions. Actually, there are already packages to cover those as followings.
Here, with some reasons, I don’t use those and wrote by myself. It is preferable to use existing packages in practical situation. But, this time, don’t care. You can use the functions from my GitHub repository.
The code below is to pick up the categorical columns and omit-target column. Also, it does one-hot-encoding. These are pre-processings.
include("../MLUtils.jl/src/utils.jl")

# omit-target columns
omitTargetLabel = [:ID]

# categorical columns
payLabel = ["PAY_"*string(i) for i in range(0,7) if i != 1]
categoricalLabel = ["SEX", "EDUCATION", "MARRIAGE"]

append!(categoricalLabel, payLabel)

categoricalLabel = Symbol.(categoricalLabel)

oneHotEncoded = oneHotEncode(dataOrig[categoricalLabel])
Delete the original categorical columns and omit-target column. And attach the one-hot-encoded columns.
delete!(dataOrig, categoricalLabel)
delete!(dataOrig, omitTargetLabel)

data = hcat(dataOrig, oneHotEncoded)
With splitobs() from MLDataUtils, we can split data into train and test data sets easily in almost same manner as with train_test_split() from sklearn in Python.
using MLDataUtils

trainData, testData = splitobs(shuffleobs(data), at=0.7)
By picking one specific explaining variable, I'll make a model.
# by one specific variable

logit = glm(@formula(default_payment_next_month ~ BILL_AMT4), trainData, Binomial(), LogitLink())predictedScore = predict(logit, testData[[:BILL_AMT4]])
auc(Int.(testData[:default_payment_next_month]), Float64.(predictedScore))0.5225570248314823Do simple univariate analysis. The part of the formula looks bit confusing. When we use variable inside the formula, we need to evaluate it with @eval. About this part, you can read the official page below.
explainingLabels = names(trainData)
aucOutcomes = Dict()
for label in explainingLabels

    if label == :default_payment_next_month
        continue
    end
    formula =@eval @formula(default_payment_next_month ~ $label)
    logit = glm(formula, trainData, Binomial(), LogitLink())

    predictedScore = predict(logit, testData[[label]])
    aucOutcomes[string(label)] = auc(Int.(testData[:default_payment_next_month]), Float64.(predictedScore))
end
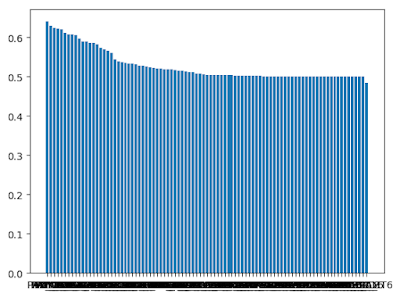
With PyPlot, we can visualize the AUC scores.
using PyPlot

labels = []
scores = []
for item in sort(collect(aucOutcomes), by=x->x[2], rev=true)
    push!(labels, item[1])
    push!(scores, item[2])
end

bar(labels, scores)
